TM 5-3895-374-24-2
Flame Safeguard Control Flame Signal Values
Table 12
Acceptable Stable Pilot and/or Main Flame Current Readings
Control
Photocell or Flame Rod
U.V.
Lead Sulfide
R7795A or C
N/A
3 ½ microamps
N/A
R7795B or D
2 microamps
N/A
N/A
R4795A (D)
2 microamps
1 ½ microamps
N/A
R4140M (G,L) or
2-5 MICROAPMS R7248A Red Amp
BC7000
2-5 microamps
3 ½ - 7 ½ microamps
3 ½ microamps R7248B Red Amp
TFM-2(3)
*14-17 DC Volt
N/A
N/A
UVM-2(3)5)
N/A
5-6 DC Volts
N/A
D Series**
15-25 DC Volts
15-25 DC Volts
15-25 DC Volts
*4-10 Microamps-with microammeter in series with S2 Wire
* * For E Series-display reading 10 min., 20 or greater normal.
to flame rod.
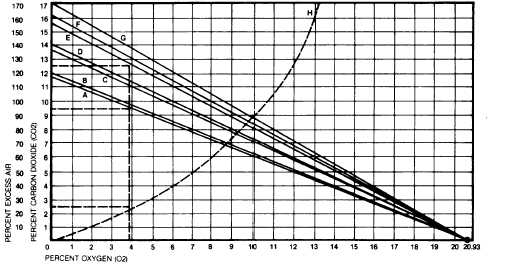
Table 13
CO2 · 02 Ratio Curves for Fuel Oils and Gases
CURVE
FUEL
MAXIMUM CO2 %
A
Natural Gas
11.7
B
Natural Gas
12.1
C
Propane
13.7
D
Butane
14.0
E
#2 Fuel Oil
15.2
F
#5 Fuel Oil
16.0
G
#6 Fuel Oil
16.9
H
Excess Air vs. O2
This curve correlates the relative values of O2 and CO2 for the
fuels listed, as well as the percentage of excess air at given O2
and CO2 values.
Example: Following the dotted line on the vertical axis from 4%
O2 to curve “H” and the dotted line on the horizontal axis to the
left, the % excess air column shows that 4% O2 equals 25%
excess air.
Following the vertical dotted line axis again from curve “H” to fuel A
(Natural Gas) and the horizontal axis to the left. the % CO2
column shows that 4% O2 and 25% excess air correlate to 9 ½%
CO2 for Natural Gas.
Again following the 4% O2 vertical axis to fuel line “E” (#2 Fuel Oil)
and to the left to the CO2 column shows that 4% O2 and 25%
excess air correlate to 12 ½% CO2 on #2 Fuel Oil.
This chart can be used to determine required CO2 or O2 values
(and therefore equivalent BTU input values) for the secondary fuel
when the burner has been properly adjusted for the primary fuel
inputs.
(page 3-988)